RISK ADJUSTED PERFORMANCE EVALUATION: IMPORTANT ASPECTS :
Important aspects of Risk Adjusted Performance Evaluation are summarized below: Breaking down asset returns:
Intuitively, we can consider the total return on an asset to be the sum of the risk free return, which is the reward for the time value of money, the beta return, which is the reward for the additional volatility of the asset, also called the market risk premium, and the alpha return, which is the superior performance attributable to the asset manager’s security selection skill.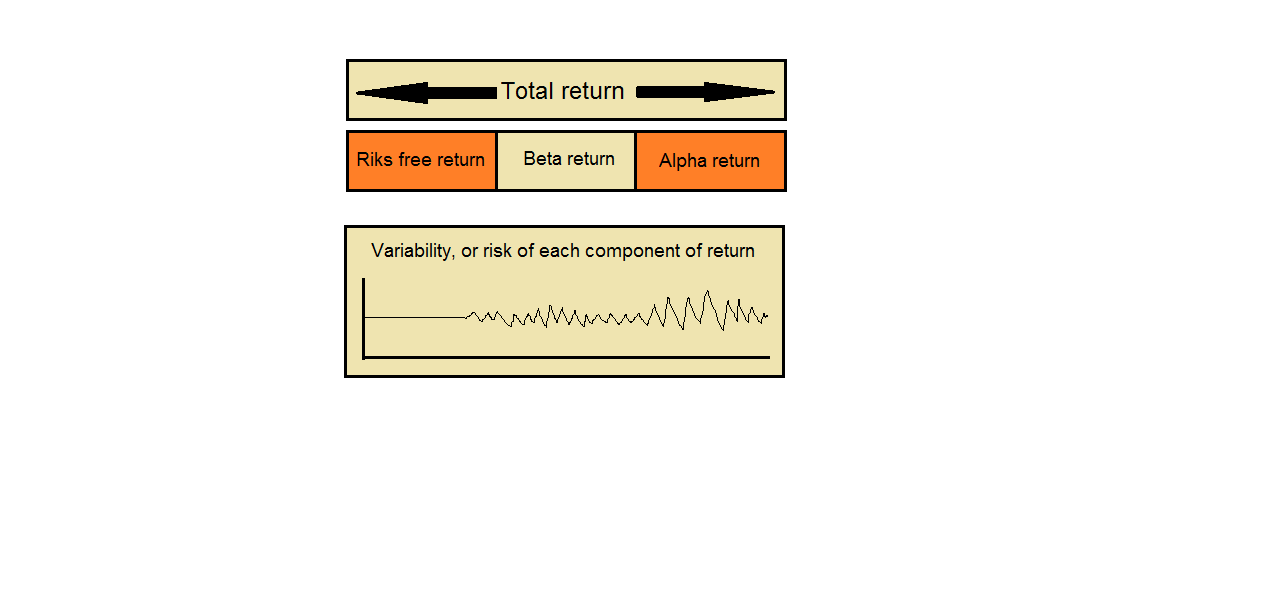
The risk free rate carries no volatility. The beta and alpha components of the return bring volatility to the asset’s return stream, and the Sharpe ratio measures the excess return earned by the asset ‘per unit of volatility’. It does so by dividing the excess return, i.e. assets return less risk free rate, by the standard deviation.
The Sharpe ratio:
The Sharpe Ratio reflects the ratio of all excess returns over the risk free rate to the total risk (or standard deviation) of the return stream. In other words, we strip out the risk free rate from the earned returns, and divide that by the total standard deviation of the returns.
The Treynor ratio:
The Treynor ratio (sometimes called the reward to-volatility ratio or Treynor measure), named after Jack L. Treynor is a measurement of the returns earned in excess of that which could have been earned on an investment that has no diversifiable risk (e.g., Treasury bills or a completely diversified portfolio), per each unit of market risk assumed
The Treynor ratio is the ratio of the excess return to the beta of the portfolio. It is similar to the Sharpe ratio, but instead of using volatility in the denominator, it uses the portfolio’s beta. Therefore the Treynor Ratio is calculated as [(Portfolio return – Risk free return)/Portfolio’s beta].
Jensen’s alpha:
Jensen’s alpha, often just referred to as alpha, is a measure of the returns that are attributable to the manager’s skill, ie the returns remaining after deducting what would have been attributable to beta returns (which do not require skill) and the risk free rate. It is the difference between the return of the portfolio, and what the portfolio should theoretically have earned. Any portfolio can be expected to earn the risk free rate (rf), plus the market risk premium (which is given by [Beta x (Market portfolio’s return – Risk free rate)]. Anything remaining over and above is the result of the manager’s security selection skill, and is alpha.
Kappa indices
One criticism of other risk adjusted performance measures is that they take both upside and downside risk into account, even though a portfolio manager or investor is only concerned with managing the downside. Kappa indices, which include the Sortino ratio and the Omega statistic, consider semi-variance, ie variance calculated only in respect of the downside risk instead of variance based on all returns. One problem with metrics based on semi-variances is that they are not mathematically tractable, ie it is difficult to do much more with them once they have been calculated.
The Information Ratio:
The Information Ratio, often used in the hedge fund world, is the ratio of the alpha component of total returns to the standard deviation of these excess alpha returns. The alpha component is the return that is attributable to the manager’s skill (or luck ;-), and is the residual after taking out the risk free return and the beta components from the total returns. Also note the difference in the denominator – while the Sharpe ratio considers the standard deviation of the total returns, the information ratio considers the variability of only the alpha component of the return (which also forms the numerator). In other words, the information ratio is merely Jensen’s alpha divided by its standard deviation. The higher the information ratio, the greater the chances of the manager making money.
The information ratio only looks to compute the return per unit of risk undertaken for the alpha component. This is important because alpha returns are risky, as they represent a zero sum game for the market as a whole. In fact, average alpha for the market as a whole is in practice slightly less than zero because of transaction and other costs. Therefore it is easy for a manager to take on ‘alpha risk’ and lose money that will bite into the beta returns.
Interpreting the information ratio, or why is the information ratio important?
The information ratio is very useful to understand how risky is dabbling with the alpha in question. If we were to assume that alpha returns will be normally distributed, then the information ratio allows us to model the alpha as being a distribution with mean = IR and standard deviation = 1. This is intuitive because IR = (mean alpha return/ standard deviation of alpha returns). A ratio of say, 0.4 can be interpreted to imply a normal distribution with mean equal to 0.4 and a standard deviation of one. From this point, everything is easy because we can now estimate the probability of losing money, or the probability of meeting a benchmark.